Trading in the financial markets is a complex endeavor that requires a deep understanding of market dynamics, a keen eye for detail, and a robust strategy. One such strategy that has proven to be effective for many traders involves the use of Hull Moving Averages (HMA). This article will delve into the intricacies of this strategy, providing you with a comprehensive guide on how to utilize it effectively in your trading journey. We’ll explore the concept of HMA, the specifics of the strategy, risk management techniques, and the importance of backtesting. By the end of this guide, you’ll have a solid understanding of the HMA trading strategy and how to apply it in your trading activities.
Understanding the Hull Moving Average (HMA)
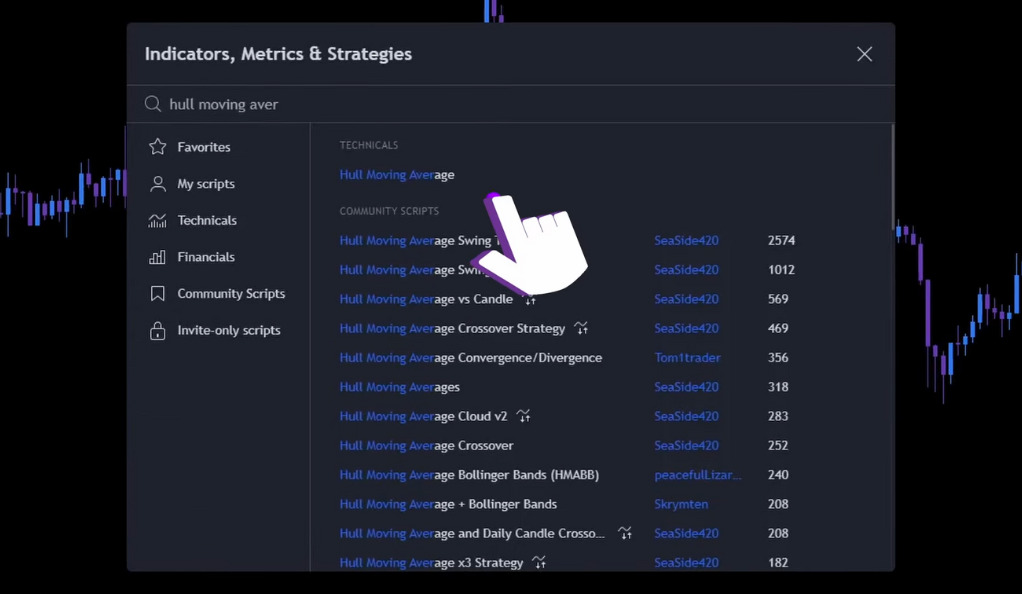
Before we delve into the strategy, it’s essential to first understand the Hull Moving Average (HMA). The HMA is a unique type of moving average that assigns more weight to recent price data, making it highly responsive to price changes. This feature allows traders to quickly react to market shifts, providing a more accurate representation of the market’s direction. The HMA is renowned for its smoothness, which helps filter out market noise—price fluctuations that deviate from the underlying trend. By smoothing out these fluctuations, the HMA helps traders identify genuine market trends, enhancing the accuracy and profitability of their trading decisions.
The HMA was the brainchild of Alan Hull, a trader and mathematician. Hull aimed to create a moving average that was “responsive to current price activity while maintaining curve smoothness.” The result was the HMA, a moving average that uniquely combines speed and smoothness. This blend allows traders to identify and capitalize on trends more effectively, making the HMA a valuable tool in any trader’s arsenal. Whether you’re a seasoned trader or a beginner, understanding and utilizing the HMA can significantly enhance your trading strategy.
The Two HMAs in Our Strategy
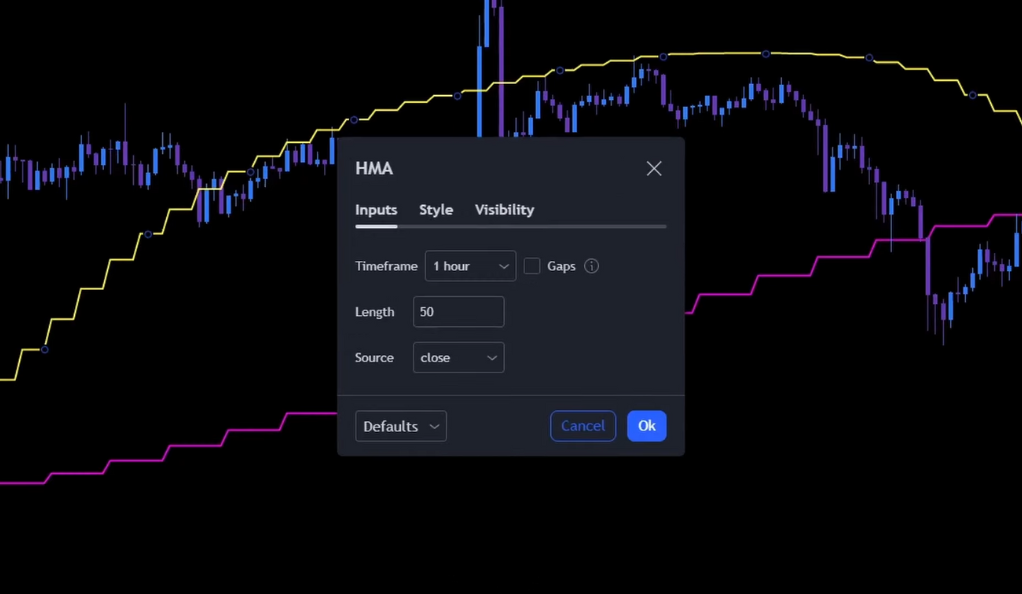
In the trading strategy we’re discussing, two specific Hull Moving Averages (HMAs) play a pivotal role. The first HMA is configured to a 1-hour timeframe with a length of 50, represented by a yellow line on the chart. The second HMA, depicted by a pink line, is set to a 2-hour timeframe with a length of 80. These two HMAs, with their distinct settings, serve as the primary indicators for pinpointing the opportune moments to enter and exit trades.
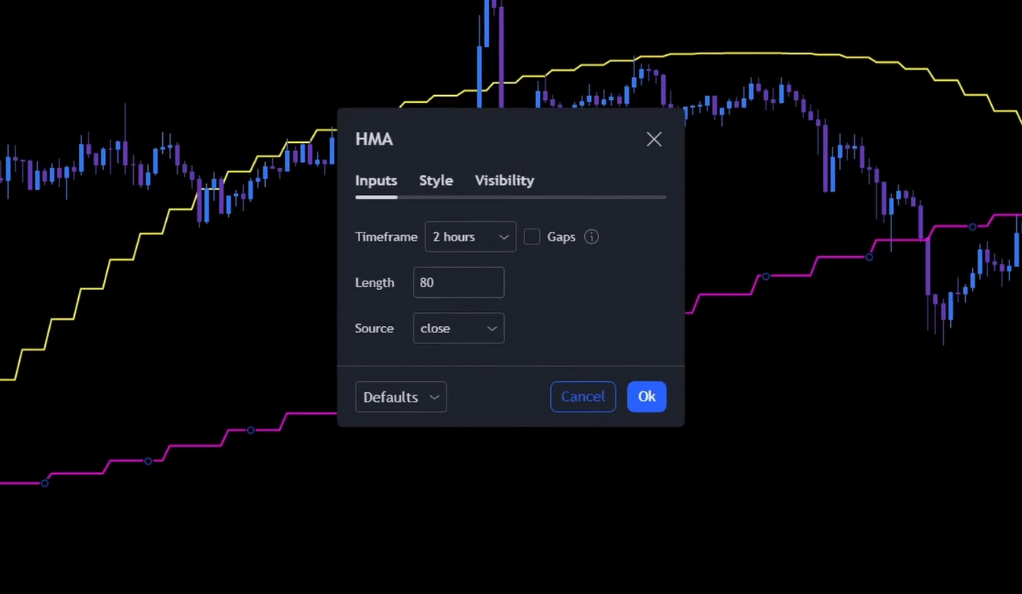
The selection of these particular timeframes and lengths is not arbitrary but is the result of meticulous planning and extensive backtesting. The 1-hour and 2-hour timeframes strike an ideal balance between being responsive to price changes and reducing market noise. Similarly, the lengths of 50 and 80 periods for the HMAs have been found to be optimal through rigorous testing, providing a harmonious blend of responsiveness and trend identification. This combination forms a robust tool that aids traders in spotting potential trading opportunities and making informed decisions.
Long Entry: Spotting the Opportunity
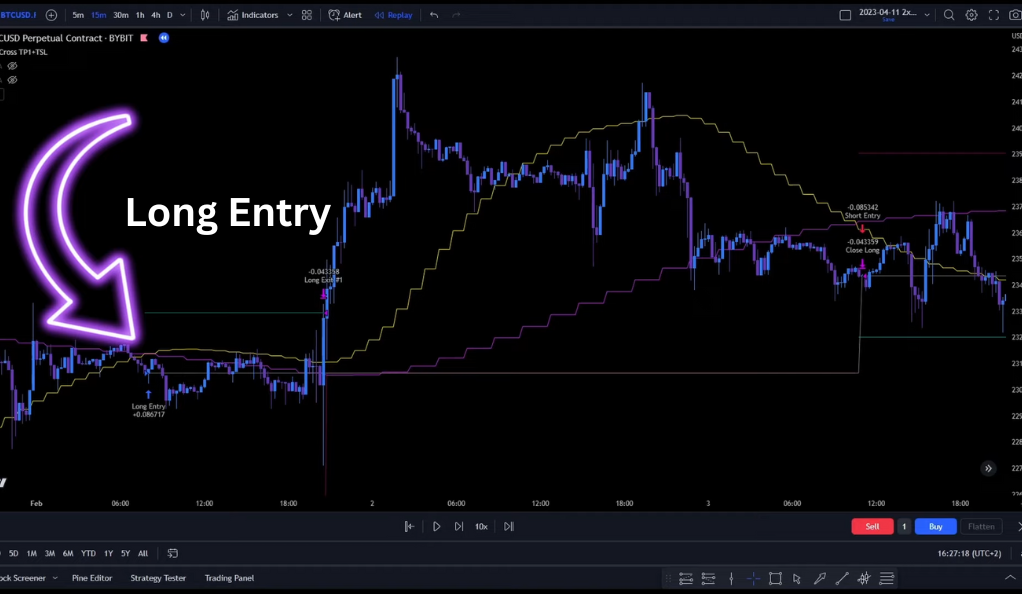
A long position is entered when the 50 HMA (yellow line) crosses above the 80 HMA (pink line). This crossover signifies a potential upward trend, signaling a good opportunity to enter a long position. But how do we manage our risk? This is where the concept of stop loss and take profit comes into play. These are predetermined levels at which a trade will be closed, either to limit potential losses (stop loss) or to secure profits (take profit).
Risk Management: Setting the Stop Loss and Take Profit
In this strategy, the stop loss for a long position is set at 6%, and the first take profit target is set at 1%. Once the first target is hit, 50% of the position is closed, and the stop loss is moved to the entry point. This approach ensures that we lock in profits and minimize potential losses. The stop loss and take profit levels are not set in stone and can be adjusted based on the trader’s risk tolerance and the volatility of the asset being traded.
Trailing the Stop Loss: Maximizing Profits
As the price increases, the stop loss is trailed upwards. This allows us to ride the trend and maximize our profits. The rest of the position is closed either when the stop loss is hit or when the 50 HMA crosses below the 80 HMA. Trailing the stop loss is a dynamic way of locking in profits while still giving the trade room to grow. It’s a technique that can significantly enhance the profitability of a strategy, especially in trending markets.
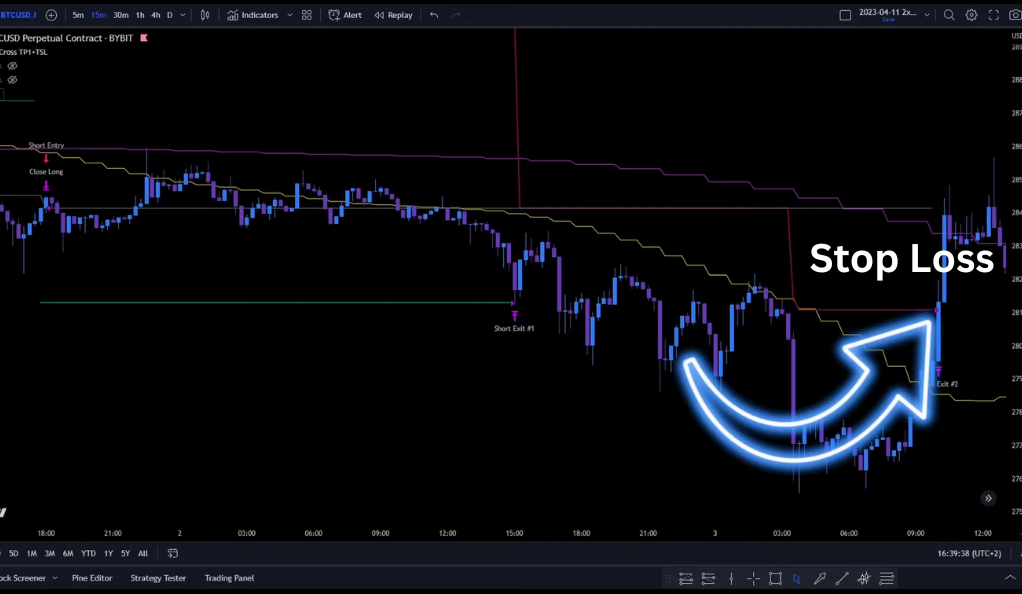
Short Entry: Capitalizing on Downward Trends
A short position is entered when the 50 HMA (yellow line) crosses below the 80 HMA (pink line). This indicates a potential downward trend, providing an opportunity to profit from falling prices. The stop loss for a short position is set at 2%, and the first take profit target is set at 1%. Just like with long entries, these levels are not fixed and can be adjusted based on the trader’s risk tolerance and the asset’s volatility.
Backtesting the Strategy: Proof of Concept
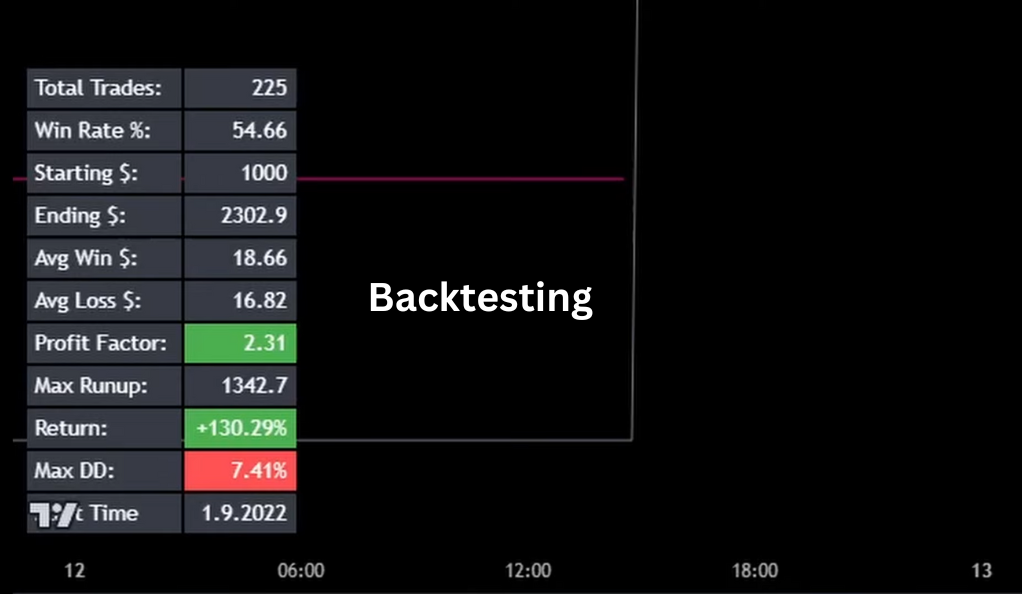
This strategy was backtested 100 times on the BTC/USD pair on a 15-minute timeframe, resulting in a win rate of almost 55%. The profit factor was 2.31, and the return was more than 130%. These results provide a strong testament to the effectiveness of this strategy. Backtesting is a crucial step in the development of any trading strategy. It involves applying the strategy to historical data to see how it would have performed. This gives us an idea of the strategy’s profitability and risk characteristics.
Flexibility: Adapting to Different Markets and Timeframes
One of the strengths of this strategy is its adaptability. It can be adjusted and tested on different assets and timeframes. This flexibility allows traders to apply this strategy across various market conditions and trading styles. Whether you’re a day trader focusing on short-term price movements or a swing trader looking for longer-term trends, this strategy can be tailored to suit your needs. However, it’s important to note that different assets and timeframes may require adjustments to the strategy parameters, such as the lengths of the HMAs and the stop loss and take profit levels.
Leverage and Strategy Scripts: Enhancing the Strategy
The creator of this strategy also mentions using a leverage of 2x and having a strategy script available for Patreon members. These tools can further enhance the effectiveness of the strategy, providing traders with more opportunities to profit. Leverage allows traders to control larger positions with a smaller amount of capital, potentially amplifying profits. However, it’s important to note that leverage also amplifies losses, so it should be used with caution. Strategy scripts, on the other hand, automate the application of the strategy, reducing the potential for human error and allowing the trader to focus on other aspects of their trading.
Conclusion
Mastering the Hull Moving Average trading strategy can be a game-changer for traders looking to capitalize on market trends. With its focus on risk management, adaptability, and proven effectiveness, it’s a strategy worth considering in your trading toolkit. Remember, though, that trading involves risk, and past performance is not indicative of future results. Always do your own research and consider your risk tolerance before implementing any trading strategy. As with any trading strategy, the HMA strategy requires practice and patience. But with time and dedication, it can become a powerful tool in your trading arsenal. Happy trading!
Ainu Token aims to offer impartial and trustworthy information on cryptocurrency, finance, trading, and shares. However, we don't provide financial advice and recommend users to conduct their own studies and thorough checks.

Comments (No)