In the vast universe of financial markets, trading strategies are as diverse as the stars in the sky. One strategy that has carved a niche for itself among traders is breakout trading. This method capitalizes on price movements that break beyond key support or resistance levels, often leading to substantial price shifts. This comprehensive guide will delve into the intricacies of breakout trading, providing insights into how to identify breakout patterns, predict breakout directions, set profit targets, and choose the right assets for breakout trading.

Understanding Breakout Trading
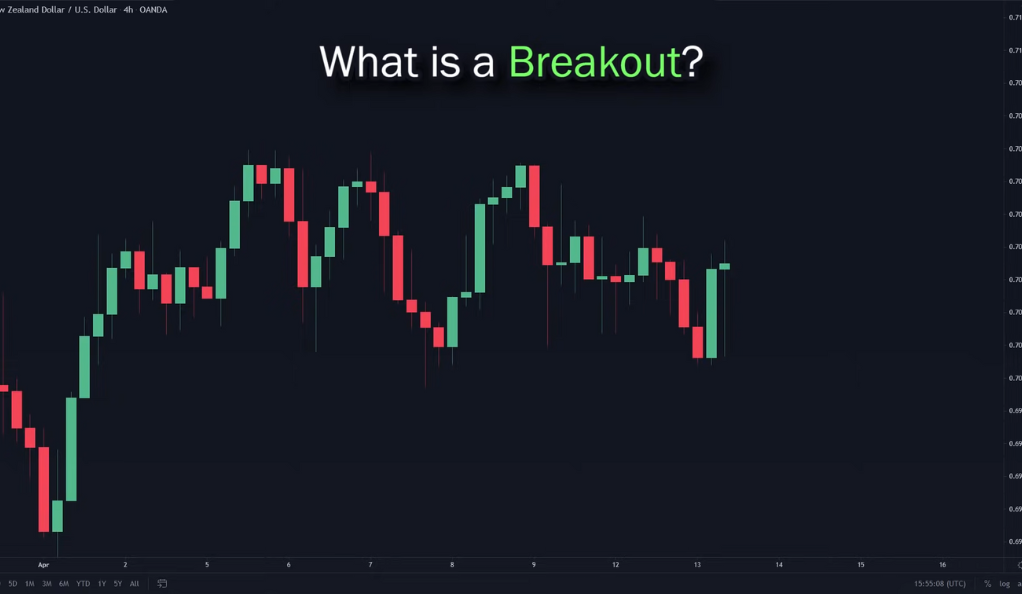
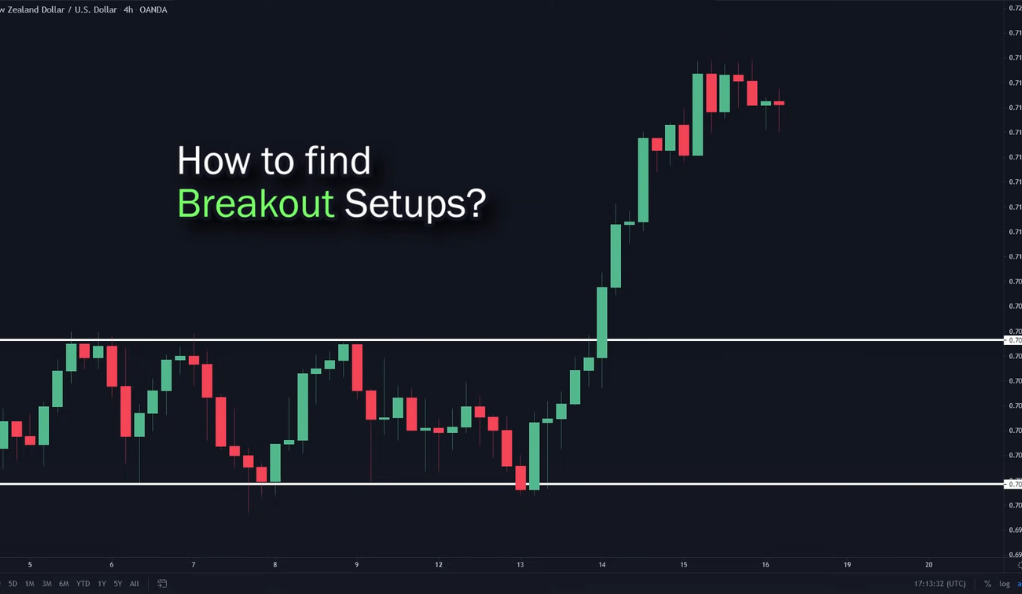
Breakout trading is a strategy that revolves around the concept of price breakouts in financial markets. A price breakout occurs when the price of an asset moves beyond a defined support or resistance level with increased volume. These breakouts often lead to significant price movements, offering traders the opportunity to make substantial profits.
The underlying principle of breakout trading is rooted in the fundamental law of supply and demand. When either buyers or sellers gain the upper hand during a period of price consolidation, a breakout occurs. This shift in power can trigger a significant price movement, creating potential profit opportunities for traders.
The Psychology Behind Breakouts
The psychology behind breakouts is indeed a captivating aspect of trading. When prices are in a period of consolidation, it signifies a balance of power between buyers and sellers. However, a breakout, for instance, to the downside, indicates a shift in this balance, with sellers gaining the upper hand.
The Shift in Power Dynamics
This shift in power dynamics can trigger a cascade of events. Buyers who had bought at the support level, anticipating a rise in prices, are often forced to close their positions as most have a stop loss placed near a key level. This closing of positions by buyers adds to the selling pressure in the market.
The Role of Breakout Traders
Breakout traders are a significant force in market dynamics, especially during periods of high volatility. As selling pressure increases and a downward momentum is established, these traders, who have been waiting for such market conditions, enter the market. Their participation adds to the existing selling force, further driving prices down.
Their strategies often involve setting specific price levels, or ‘breakpoints’, at which they enter the market. These breakpoints are typically set at key levels of support or resistance. When these levels are breached, breakout traders act, adding their selling or buying power to the existing market momentum.
The Psychological Aspects at Play
This chain of events highlights the psychological aspects at play during a breakout. Traders’ reactions to changes in market conditions, driven by their risk tolerance, trading strategy, and market expectations, collectively contribute to the formation of breakout patterns. Understanding this psychology can provide valuable insights into market dynamics and can enhance a trader’s ability to predict and capitalize on breakouts.
Identifying Breakout Patterns

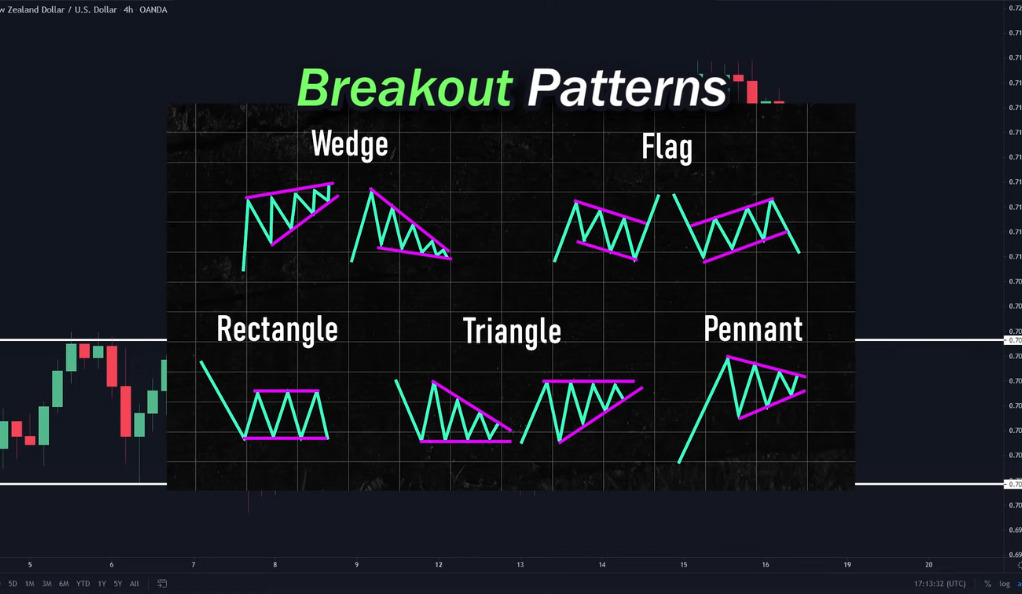
Identifying breakout patterns is central to breakout trading. These patterns, including rectangles, pennants, wedges, and triangles, signal potential breakouts. The key lies not in finding exact pattern matches, but in discerning key levels of support and resistance.
Breakout patterns are distinct formations on price charts that indicate potential significant price movements. For instance, a rectangle pattern emerges when the price of an asset bounces between parallel support and resistance levels, suggesting a potential breakout when either buyers or sellers gain the upper hand.
Support and resistance levels, often determined by previous highs and lows, are crucial in identifying breakout patterns. A breach of these levels often signals a breakout, making their accurate identification vital for successful breakout trading. Understanding how to identify these key levels is a fundamental skill for breakout trading mastery.
Predicting the Direction of Breakouts
Predicting the direction of breakouts is a critical skill in breakout trading, but it’s not as simple as it might initially seem. One of the challenges traders often face is the occurrence of false breakouts. These are situations where the price appears to break a key level, such as a level of support or resistance, only to reverse direction and move back within the previous range. False breakouts can lead to losses if traders aren’t careful, as they might be tricked into thinking a significant price move is about to occur, only for the price to reverse direction.

To help navigate this challenge, traders often look for what are known as momentum candles at the breakout point. Momentum candles are a type of candlestick pattern that indicates a strong price movement in a particular direction. They typically have a large body, which represents a strong price move during the candle’s time period, and small or non-existent wicks, which indicates that the price closed near its high or low.
The appearance of a momentum candle at a key level of support or resistance can suggest that the market has enough momentum to sustain a breakout. By waiting for these momentum candles, traders can increase their chances of accurately predicting the direction of a breakout, which can lead to more successful trades and potentially greater profits.
Positioning and Setting Stop Losses
Once a potential breakout has been identified and its direction predicted, the next step is to position oneself in the market and set a stop loss. The recommended strategy is to enter a buy position at the close of the momentum candle and set a stop loss slightly below the key level.
This approach ensures that the trader benefits regardless of the scenario that unfolds. If the price continues to rise, the trader stands to make a profit. If the price pulls back towards the key level before rising again, the stop loss would not be hit, and the trader would still stand to make a profit. If it turns out to be a false breakout and the price reverses downwards, the stop loss would be hit, preventing the trader from incurring further losses.
Setting Profit Targets: The Two-Step Take Profit System
Setting profit targets is a fundamental component of any trading strategy, and breakout trading is no exception. The two-step take profit system is a unique method that allows traders to optimize their profits during breakouts.

The first step in this system involves setting a fixed profit target at 1.5 times the stop loss. This ratio is not arbitrary but is based on a risk-reward analysis that aims to ensure that potential profits outweigh potential losses. If this target is hit, the trader closes half of their positions and moves the stop loss to break even. This strategy allows the trader to secure some profit while still leaving room for further gains if the price continues to move in their favor.
The second step in the two-step take profit system involves applying the chandelier stop indicator. This is a volatility-based indicator that adjusts with the market price, providing a more dynamic approach to setting stop losses. The trader lets the remaining trades run until the indicator changes color, which signals a change in trend. This strategy allows the trader to capitalize on any further price movement in their favor, potentially leading to larger profits.
In essence, the two-step take profit system is a balanced approach that allows traders to secure profits early while still giving the trade room to run if the price continues to move favorably. This strategy can be particularly effective in breakout trading, where price movements can be significant. As with any trading strategy, it’s important to remember that market conditions can change rapidly, and traders should always be prepared to adjust their strategies as needed.
Choosing the Right Assets for Breakout Trading
Choosing the right assets for breakout trading is a crucial aspect of the strategy. The success of breakout trading can be significantly influenced by the type of asset being traded. Not all assets are created equal when it comes to their suitability for breakout trading.
Assets that are prone to sudden, large movements, such as cryptocurrencies, are particularly well-suited to this strategy. These assets often exhibit high volatility, which means they can experience significant price changes in a short period. This volatility can create numerous opportunities for breakout traders, as it increases the likelihood of significant price movements that can lead to profitable breakouts.
However, volatility is not the only factor to consider when choosing assets for breakout trading. Liquidity, or the ease with which an asset can be bought or sold without affecting its price, is another important factor. High liquidity means that large orders are less likely to cause significant price changes, which can be beneficial for breakout traders who often need to enter and exit trades quickly.
Conclusion
Breakout trading is a powerful strategy that, when used correctly, can yield significant profits. By understanding how to identify breakout patterns, predict breakout directions, and set appropriate stop losses and profit targets, traders can harness the power of breakouts.
However, like any trading strategy, it requires practice, patience, and a keen understanding of market dynamics. It’s also important to remember that while breakout trading can be profitable, it’s not without risks. Therefore, traders should always use risk management strategies to protect their capital.
Ainu Token aims to offer impartial and trustworthy information on cryptocurrency, finance, trading, and shares. However, we don't provide financial advice and recommend users to conduct their own studies and thorough checks.

Comments (No)