The financial landscape of 2023 has been marked by a significant market crash. However, every crisis presents an opportunity. In this case, it’s a chance for substantial gains, provided you follow a meticulous 10-step plan. This article will guide you through this plan, offering insights into the current market situation and providing strategies to capitalize on it.
Understanding the Market Divide
The financial market in 2023 is characterized by a significant divide, with investors split into two distinct camps. One group believes that the market has already hit its lowest point and is poised for a rebound. They argue that the worst is over and that it’s time to start investing again, anticipating a market recovery. This group is optimistic, viewing the current market situation as a temporary downturn in an otherwise upward trend.
On the other hand, the second group foresees a further decline in the market. They believe that the current situation is just the beginning of a more significant downturn. This group is more pessimistic, predicting that the market will continue to fall for a while before it starts to recover. They argue that it’s safer to hold off on investing until there are clearer signs of recovery.
The key to navigating this divide is not to rely on feelings or gut instincts but to use factual data and statistical analysis. By examining market trends, economic indicators, and other relevant data, investors can make more informed decisions about when and where to invest. This approach requires patience and discipline, but it can potentially lead to better investment outcomes.
The Role of Interest Rates
Interest rates play a crucial role in the financial market, influencing investment decisions and market trends. When the Federal Reserve raises interest rates, borrowing costs increase, making it more expensive for companies to finance their operations and for individuals to take out loans. This can lead to a decrease in corporate profits and consumer spending, which can cause the stock market to fall.

Rising interest rates can also make riskier investments like stocks and real estate less appealing. When interest rates are high, safer investments like bonds become more attractive because they offer a guaranteed return. This can lead to a shift in investment from riskier assets to safer ones, causing the prices of stocks and real estate to fall.
Observing the Rise in Interest Rates
The first step in our plan is to closely observe the rise in interest rates. This process has already begun, with the Federal Reserve gradually increasing rates in response to economic conditions. This rise in interest rates is a key indicator of the state of the economy and the financial market.
When interest rates rise, it becomes more expensive to borrow money. This can lead to a decrease in spending and investment, which can cause the economy to slow down. On the other hand, rising interest rates can also be a sign of a strong economy. When the economy is doing well, the Federal Reserve often raises interest rates to keep inflation in check.
Therefore, observing the rise in interest rates can provide valuable insights into the state of the economy and the financial market. By closely monitoring interest rates and understanding their impact, investors can make more informed decisions about when and where to invest.
Risk-Taking and Interest Rates
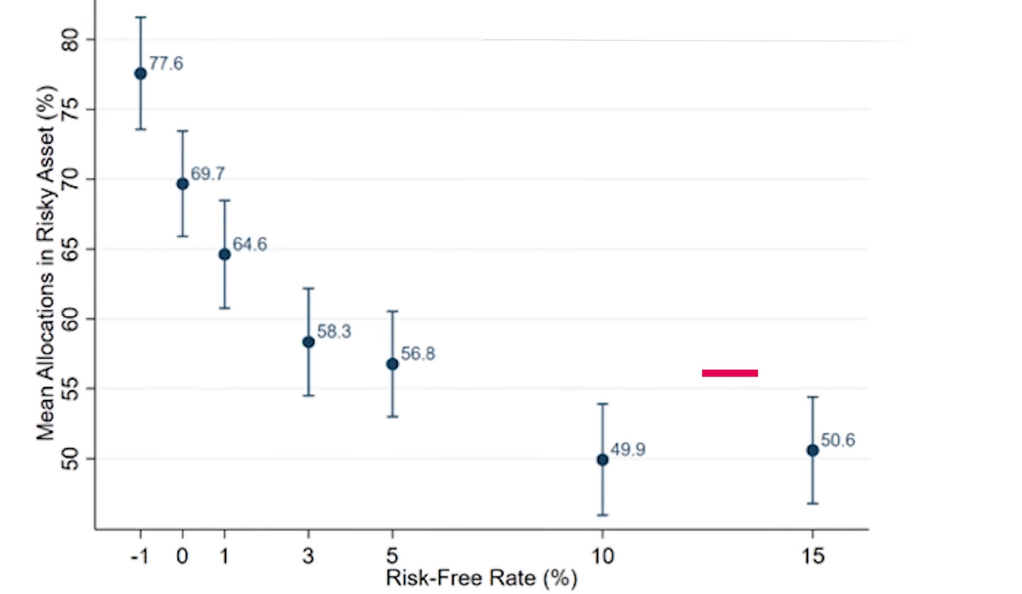
A study from Harvard University provides valuable insights into the relationship between interest rates and risk-taking. The study found that when risk-free returns are low, investors tend to take more risks in search of higher yields. This can lead to an increase in investment in riskier assets, driving up their prices.
However, when risk-free returns are high, the study found that risk-taking decreases. This is because investors can earn a decent return without taking on much risk. As a result, they are less likely to invest in riskier assets, causing their prices to fall.
The Interest Rate Journey and Market Reversal
The next steps in our plan involve tracking the journey of interest rates. After rising, they will start to slow down, then freeze, and finally begin to descend. This downward shift will signal the market bottom and the start of a reversal.

When interest rates start to slow down, it can be a sign that the economy is starting to cool off. This can lead to a decrease in investment and spending, which can cause the market to fall. However, this can also be a good time to start looking for investment opportunities because prices are likely to be lower.
When interest rates freeze, it can be a sign that the economy is in a state of equilibrium. This can be a good time to invest because prices are likely to be stable. However, it’s also important to keep an eye on other economic indicators to ensure that the economy is not about to enter a downturn.
When interest rates start to descend, it can be a sign that the economy is starting to recover. This can lead to an increase in investment and spending, which can cause the market to rise. This is the ideal time to invest because prices are likely to be on the rise.
Interest rates Pivotal role in Market movements
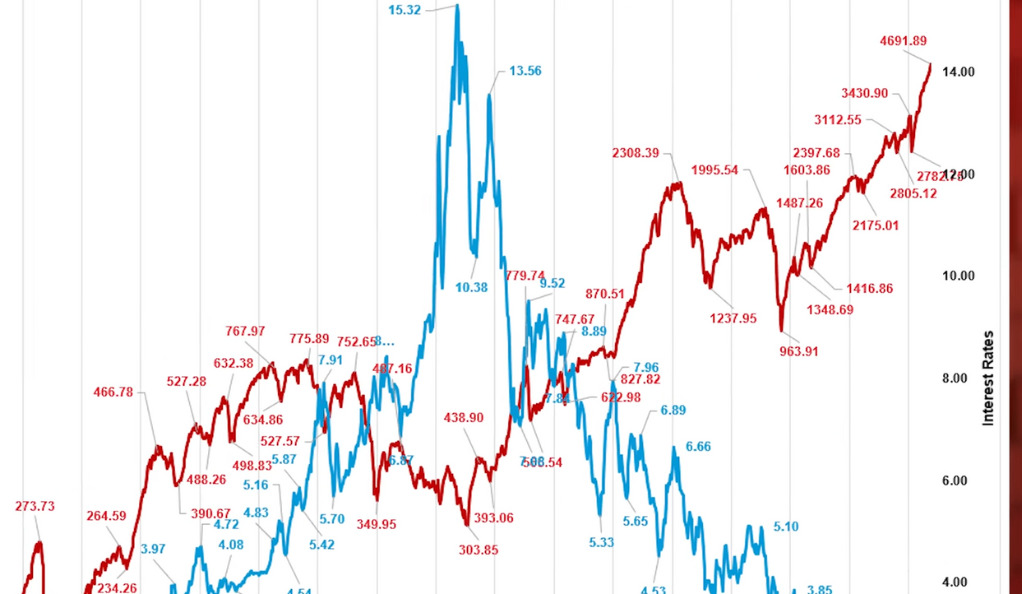
They are a key tool used by central banks to control monetary policy and influence economic activity. When interest rates rise, borrowing costs increase, making it more expensive for businesses to finance their operations and for consumers to borrow for purchases. This can lead to a decrease in corporate profits and consumer spending, which can cause the stock market to fall. Conversely, when interest rates are lowered, borrowing becomes cheaper, stimulating spending and investment, which can boost the stock market. Therefore, a strong correlation exists between interest rates and market movement, making them a crucial factor for investors to monitor.

Predicting the Market Bottom
Predicting the market bottom is not an exact science. It requires careful analysis of market trends, economic indicators, and other relevant data. However, by closely monitoring these factors and understanding their impact on the market, investors can make more informed decisions about when to invest.
One key indicator to watch is the level of interest rates. When interest rates start to descend, it can be a sign that the market is about to hit bottom. However, it’s also important to consider other factors, such as economic growth, inflation, and political stability.
Risk- Free Rate
The risk-free rate is a theoretical concept in finance, representing the interest an investor would expect from an absolutely risk-free investment over a specified period of time. In practice, the yield on a government bond of a financially stable country, such as U.S. Treasury bonds, is often used as the risk-free rate because the chance of the government defaulting is extremely low. The risk-free rate is a fundamental element in the calculation of the cost of capital and in the assessment of investment risk. It serves as a benchmark against which the returns on other investments are measured. If an investment offers a return below the risk-free rate, it’s generally considered not worth the risk.

The Bitcoin Halving Event
The Bitcoin halving event is a key event in the crypto market. It occurs approximately every four years and reduces the reward for mining new blocks by half. This effectively reduces the supply of new bitcoins, which can lead to an increase in the price of Bitcoin.
The next Bitcoin halving event is expected to occur in 2024. If the market follows the same pattern as previous halving events, this could lead to a significant increase in the price of Bitcoin. Therefore, investors who are interested in crypto should consider this event when planning their investment strategy.
Additional Tactics for Timing the Market
To increase the chances of timing the market accurately, we can use additional tactics. These include observing the yield curve, the put-to-call ratio, the VIX, and the 200-day moving average.
The yield curve is a graph that shows the relationship between interest rates and the maturity of bonds. When the yield curve is inverted, it can be a sign that a recession is imminent. Therefore, investors should monitor the yield curve to help predict market trends.
The put-to-call ratio is a measure of the trading volume of put options to call options. A high put-to-call ratio can be a sign that investors are bearish, while a low put-to-call ratio can be a sign that investors are bullish. Therefore, investors should monitor the put-to-call ratio to help predict market trends.
The VIX, or Volatility Index, is a measure of expected market volatility. A high VIX can be a sign of market uncertainty, while a low VIX can be a sign of market stability. Therefore, investors should monitor the VIX to help predict market trends.
The 200-day moving average is a popular technical indicator that can help identify long-term trends in the market. When the market price is above the 200-day moving average, it can be a sign of an upward trend. On the other hand, when the market price is below the 200-day moving average, it can be a sign of a downward trend. Therefore, investors should monitor the 200-day moving average to help predict market trends.
The Final Step: Selling and Profiting
The final step of our plan is to sell everything once the market has rebounded, leading to substantial profits. However, this step requires careful timing and strategic decision-making.
Selling at the right time is crucial to maximizing profits. If you sell too early, you might miss out on potential gains. On the other hand, if you sell too late, you might see your profits diminish as the market starts to decline again.
Therefore, it’s important to monitor market trends and economic indicators closely to determine the best time to sell. This requires patience and discipline, but it can potentially lead to substantial profits.
Ainu Token aims to offer impartial and trustworthy information on cryptocurrency, finance, trading, and shares. However, we don't provide financial advice and recommend users to conduct their own studies and thorough checks.

Comments (No)