In the dynamic and complex world of trading, strategies serve as the backbone of any successful venture. But how can we ascertain the effectiveness of a strategy? The answer lies in a process known as backtesting. In this article, we’ll delve into the intricate process of backtesting a trading strategy, using a specific case study for clarity. We’ll cover everything from the initial strategy selection to the interpretation of results, providing a comprehensive guide for both novice and experienced traders. So, let’s embark on this journey of discovery!
Understanding Backtesting
Backtesting is a method used by traders to evaluate the viability of a trading strategy. It involves applying the strategy to historical data to see how it would have performed. This gives traders a glimpse into the potential future performance of the strategy, providing a solid foundation for decision-making. It’s akin to a time machine, allowing traders to travel back and see how their strategy would have fared in the past. This process, while not foolproof, offers a robust way to gauge the potential of a strategy before risking real capital.
The Power of Trading Strategy
Our case study revolves around a strategy found on the Power of Trading channel. This strategy was initially applied to the Euro-USD-15 Minutes Chart, where it reportedly achieved an account growth of up to 300% in 15 days. Intrigued by these results, we decided to backtest this strategy on the Bitcoin chart, a popular and volatile cryptocurrency, to see if the strategy could be as effective in a different market. This decision underscores the importance of flexibility in trading, as strategies may perform differently across various markets.

The Backtesting Process
The backtest involved 100 trades, starting with an initial balance of 1000 USD and risking 2% per trade. This risk management strategy is crucial in preventing significant losses. It’s a reminder that while trading can be profitable, it’s equally important to protect your capital. The backtest spanned from July 25th to November 29th, a period of four months. The win rate was 37%, and the profit and loss (PnL) was 37.18%. The account grew from 1000 USD to 1371 USD, showing a substantial increase. This growth, while impressive, also highlights the need for patience in trading.
The Indicators Used
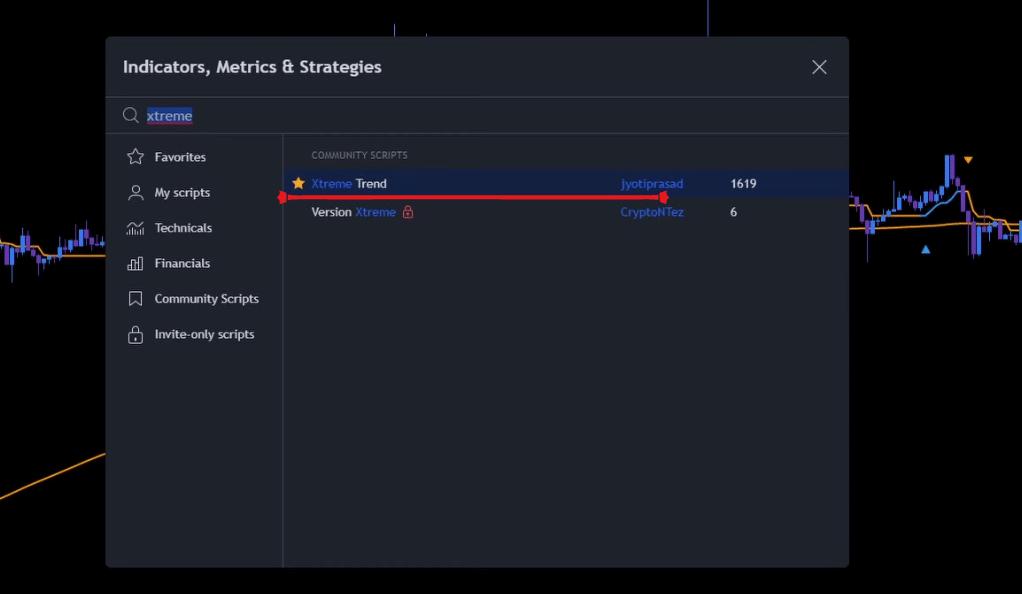
Xtreme Trend

The Xtreme Trend indicator is a powerful tool designed to identify and highlight market trends. It does this by analyzing price data and using a specific algorithm to determine whether the market is in an uptrend or downtrend. In our strategy, this indicator was crucial in providing the initial signal for potential trading opportunities. When a blue arrow was printed below the candle, it signaled a potential uptrend, indicating a possible opportunity for a long position. Conversely, an orange arrow above the candle signaled a potential downtrend, indicating a possible short position opportunity.
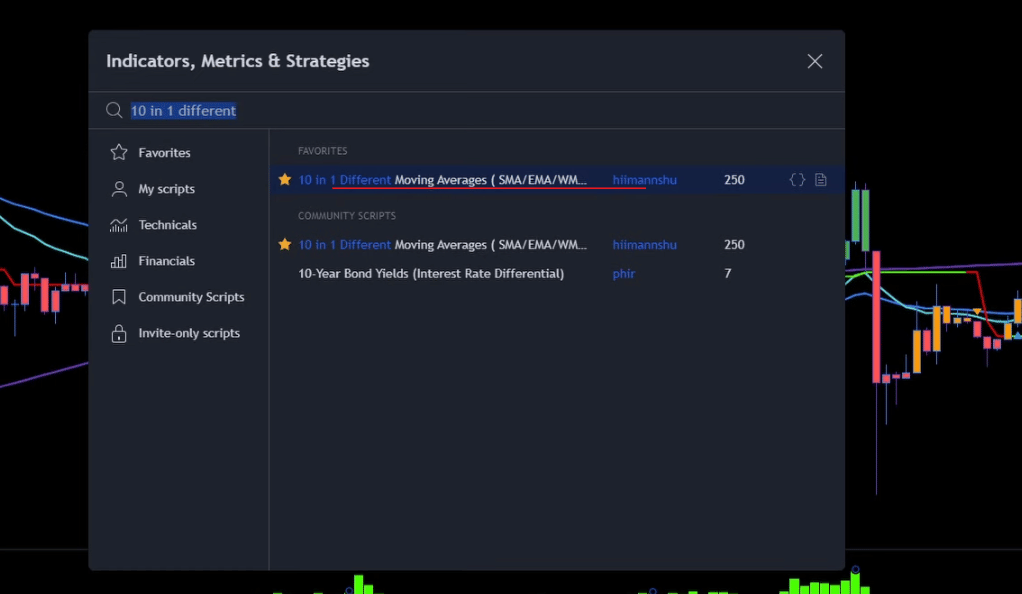
10 in 1 Different Moving Averages

Moving averages are among the most widely used indicators in trading. They help smooth out price data, providing a clearer picture of the market trend over a specific period. The “10 in 1 Different Moving Averages” indicator takes this a step further by combining ten different types of moving averages. This provides a more comprehensive view of market trends. In our strategy, the signal candle needed to close above all moving averages for a long position and below all moving averages for a short position. This ensured that the trade was in line with the overall market trend.
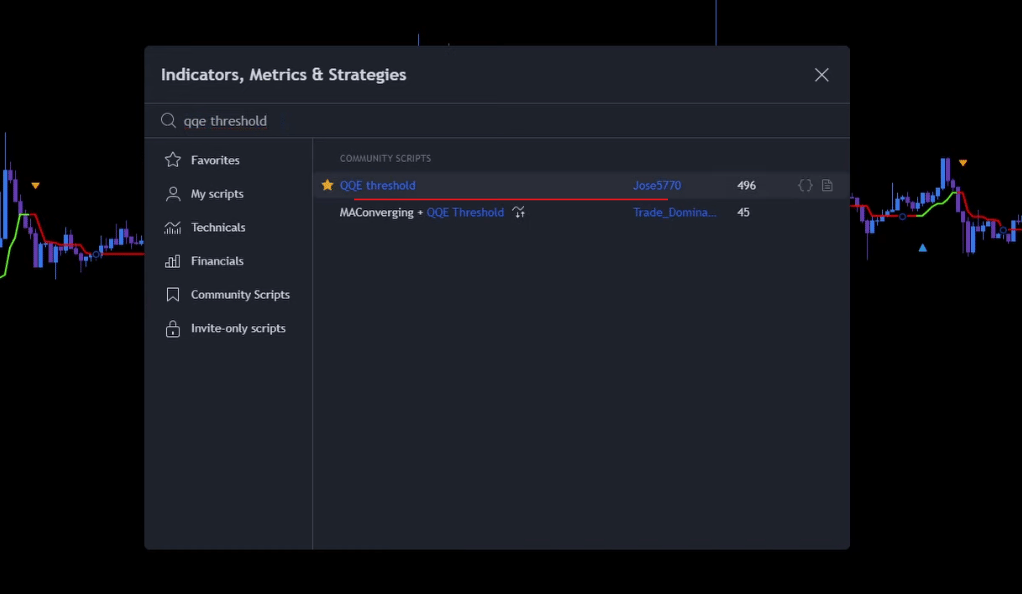
QQE Threshold

The QQE, or Quantitative Qualitative Estimation, is a versatile indicator that combines the features of oscillators with moving averages. The QQE Threshold adds a threshold level to the QQE, providing a clear signal when the market momentum is strong enough for a potential trade. In our strategy, a green histogram printed by the QQE Indicator confirmed a long position, while a red histogram confirmed a short position. This served as a final confirmation, ensuring that the trade had both trend and momentum in its favor.
The Importance of Indicator Settings
While choosing the right indicators is crucial, correctly setting them up is equally important. Each of the indicators used in our strategy had specific settings that were carefully chosen to align with the strategy’s objectives. These settings were detailed in the strategy guide, providing a clear roadmap for replication. This underscores the importance of understanding not just what your trading tools do, but also how to correctly set them up.
Entry Rules for Long and Short Positions

For a long position, three conditions must be met: a blue arrow printed below the candle, the signal candle closing above all moving averages, and a green histogram printed by the QQE Indicator. These conditions ensure that the market is in an uptrend and that the momentum is in favor of the trade. The opposite conditions apply for a short position, indicating a downtrend and a potential opportunity to profit from falling prices. These rules underscore the importance of having clear, predefined entry and exit criteria in your trading plan.
Understanding Invalid Signals
Invalid Long Signals
In the context of our trading strategy, a long signal is considered invalid under certain conditions. For instance, if the trigger candle does not close above all Moving Averages, the long signal is deemed invalid. But why is this the case?
Moving averages are a key tool in identifying the overall trend of the market. If the trigger candle does not close above these averages, it indicates that the market is not strongly bullish. In other words, the upward momentum that we seek for a long position is lacking. Entering a long position under these circumstances could be risky, as the market may not have enough bullish momentum to continue upwards. This could result in a loss if the market instead moves downwards.

Invalid Short Signals
Similarly, a short signal is invalidated if the signal candle has not closed below the 200-EMA-Line. The 200-EMA, or Exponential Moving Average, is a widely used indicator that gives greater weight to more recent price data. It’s a reliable tool for identifying long-term market trends.
If the signal candle closes above the 200-EMA, it indicates that the market is not strongly bearish. The downward momentum required for a profitable short position is missing. Entering a short position in this scenario could lead to losses if the market does not move downwards as expected but instead moves upwards.
The Importance of Signal Validation
These examples underline the importance of signal validation in trading. While indicators and trading strategies can provide us with signals, it’s crucial to validate these signals before acting on them. Invalid signals can lead to false or weak trading opportunities, which could result in losses.
By understanding the conditions that invalidate a signal, we can avoid these potential pitfalls. This not only helps in managing risk but also improves the overall effectiveness of our trading strategy.
The Results
The largest profit trade was 28%, and the largest loss trade was 11%. The strategy had 4 consecutive wins and 12 consecutive losses. This shows that while the strategy can yield high returns, it also comes with a significant risk. It’s a stark reminder that trading is not just about profits, but also about managing risks effectively. It’s crucial to understand that losses are part of the trading journey and having a plan to manage them is key.
Sharing the Results
Sharing the updated spreadsheet in a Telegram group for Patreon members. This allows for a community of traders to discuss, analyze, and improve upon the strategy. It’s a great way to learn from others and to share your insights, fostering a collaborative environment for trading. This communal approach to trading can provide invaluable insights and foster a sense of camaraderie among traders.
Conclusion
Backtesting a trading strategy is an essential step in ensuring its effectiveness. It provides a glimpse into how the strategy might perform in the future, allowing traders to make informed decisions. Our case study showed that while the Power of Trading strategy can yield high returns, it also comes with significant risk. Therefore, it’s crucial to consider all aspects of a strategy before implementing it. Remember, successful trading is not just about finding a good strategy, but also about managing risks and continuously learning and adapting. As traders, we must strive to be like bamboo – strong yet flexible, able to withstand market storms while seizing opportunities when they arise.
Ainu Token aims to offer impartial and trustworthy information on cryptocurrency, finance, trading, and shares. However, we don't provide financial advice and recommend users to conduct their own studies and thorough checks.

Comments (No)