In the ever-evolving world of trading, the quest for the perfect strategy is a journey that never ends. Traders are constantly on the lookout for new methods, tools, and indicators that can give them an edge in the market. One such strategy that has been making waves recently involves the use of artificial intelligence (AI) and a unique combination of trading view indicators. This strategy, which we’ll explore in detail, leverages the power of AI and a trio of indicators to make informed trading decisions.
The beauty of this strategy lies in its simplicity and effectiveness. By combining the predictive power of AI with the analytical prowess of carefully selected indicators, it provides a comprehensive approach to trading. Whether you’re a seasoned trader or a beginner, understanding this strategy could be a game-changer for your trading journey.
The Power of Three: Key Indicators in the Strategy
The strategy in question relies on three free trading view indicators, each playing a crucial role in the decision-making process. These are the Machine Learning Lorenztian Classification by JD Horty, the Exponential Moving Average (EMA), and the Legarre RSI by Kevanchos Viljic. Each of these indicators brings a unique perspective to the table, contributing to a holistic view of the market.
Machine Learning Lorenztian Classification
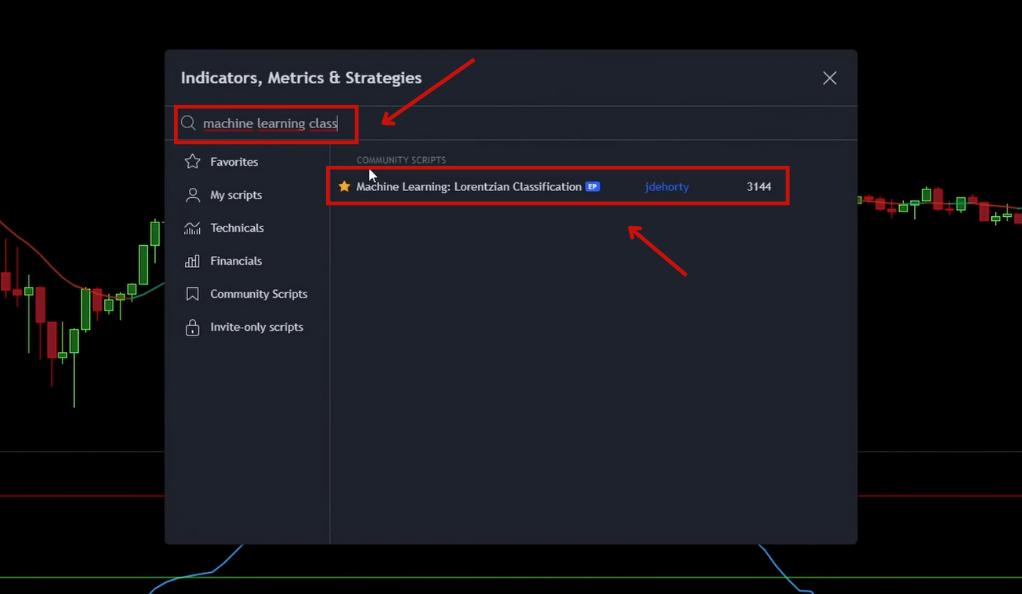
The Machine Learning Lorenztian Classification is an AI-powered indicator that uses machine learning algorithms to predict market trends. It’s like having a digital crystal ball that uses data instead of magic to foresee the market’s future. The power of this indicator lies in its ability to learn from past data and make informed predictions about future market movements.
The use of AI in trading is not new, but its application in this strategy is unique. By leveraging the power of machine learning, this indicator provides traders with valuable insights that can guide their trading decisions. It’s a testament to how AI is revolutionizing the trading landscape, providing traders with tools that were once the stuff of science fiction.
Exponential Moving Average (EMA)
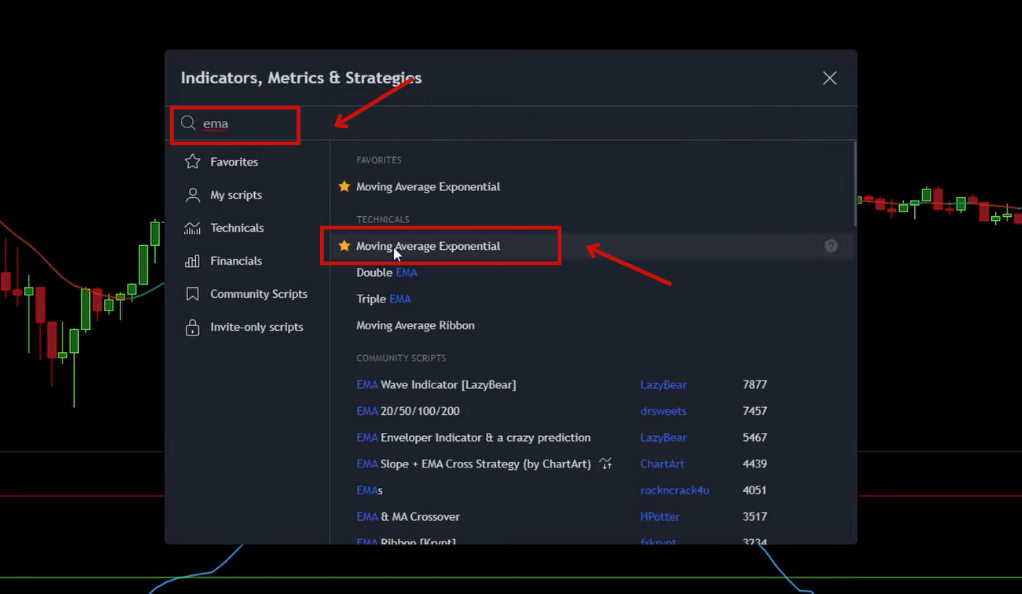
The EMA is a type of moving average that gives more weight to recent data. In this strategy, the EMA indicator is set to a length of 200, serving as a critical benchmark for determining whether to enter a long or short position. The EMA is a popular tool among traders due to its responsiveness to recent price changes.
The use of the EMA in this strategy provides a dynamic baseline that adapts to market changes. By focusing on recent data, it allows traders to respond quickly to market trends, making it an invaluable tool in fast-paced trading environments. It’s like a compass guiding traders through the choppy waters of the market.
Legarre RSI
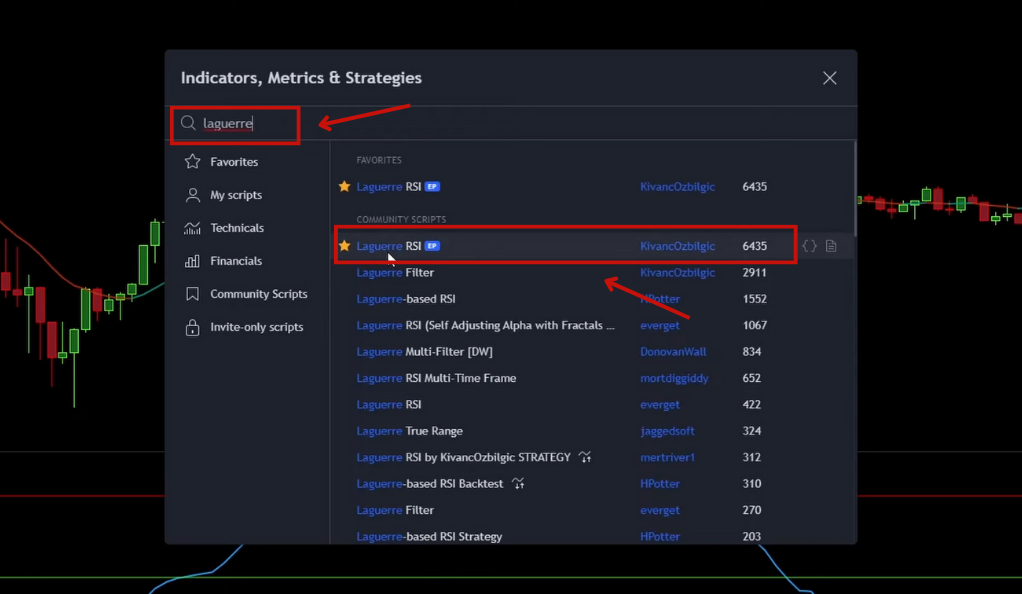
The Legarre RSI, or Relative Strength Index, is a momentum oscillator that measures the speed and change of price movements. It’s like the heartbeat monitor of the market, giving traders a sense of the market’s vitality. In this strategy, the first plot color is set to green and the second to red, providing clear visual cues for traders.
The RSI is a powerful tool that can help traders identify potential overbought or oversold conditions. By incorporating the RSI into this strategy, traders can gain a deeper understanding of market momentum and make more informed trading decisions. It’s a testament to the strategy’s comprehensive approach, combining different types of indicators to provide a well-rounded view of the market.
Rules of Engagement: Long and Short Positions
Like any good strategy, this one comes with a set of rules that dictate when to enter and exit positions. These rules are designed to maximize profits and minimize losses, providing a clear roadmap for traders. The rules are straightforward and easy to follow, making this strategy accessible to traders of all levels.
Going Long
Entering a long position involves betting that the market will rise. But when exactly should you go long? Here are the rules:
- The price action needs to close above the 200 EMA line.
- The machine learning indicator needs to print a green Buy Signal.
- The blue RSI indicator line needs to cross the green line upwards.
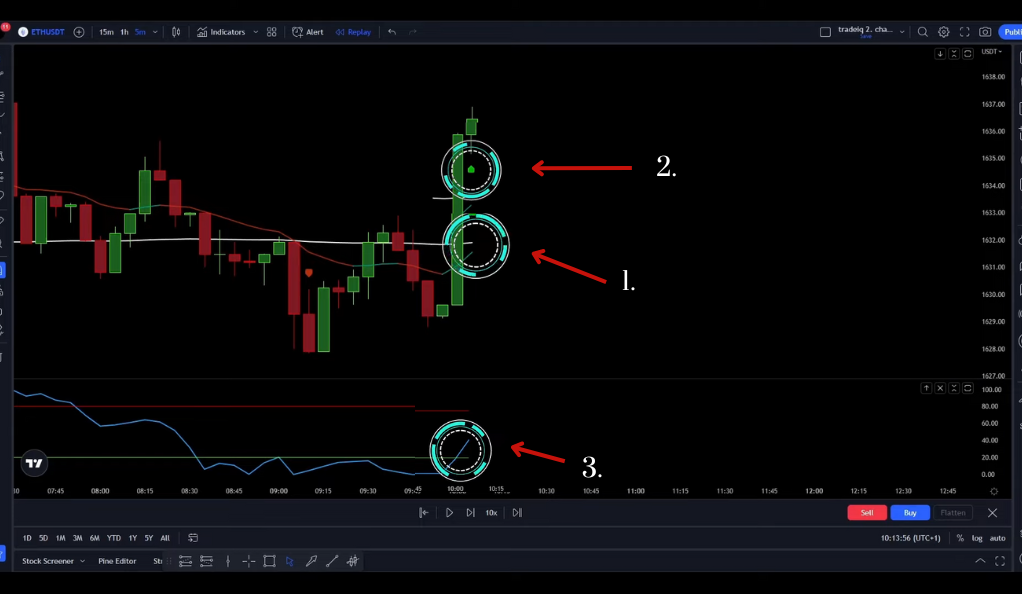
Once these conditions are met, it’s time to enter a long position. But what about the exit strategy? The stop loss is set at the recent swing low, and profit is booked once the line from the machine learning indicator turns red. This approach ensures that traders can maximize their profits while limiting their potential losses.
Going Short
On the flip side, entering a short position involves betting that the market will fall. The rules for going short are as follows:
- The price action needs to close below the 200 EMA line.
- The machine learning indicator needs to print a red Sell Signal.
- The blue RSI indicator line needs to cross the red line downwards.
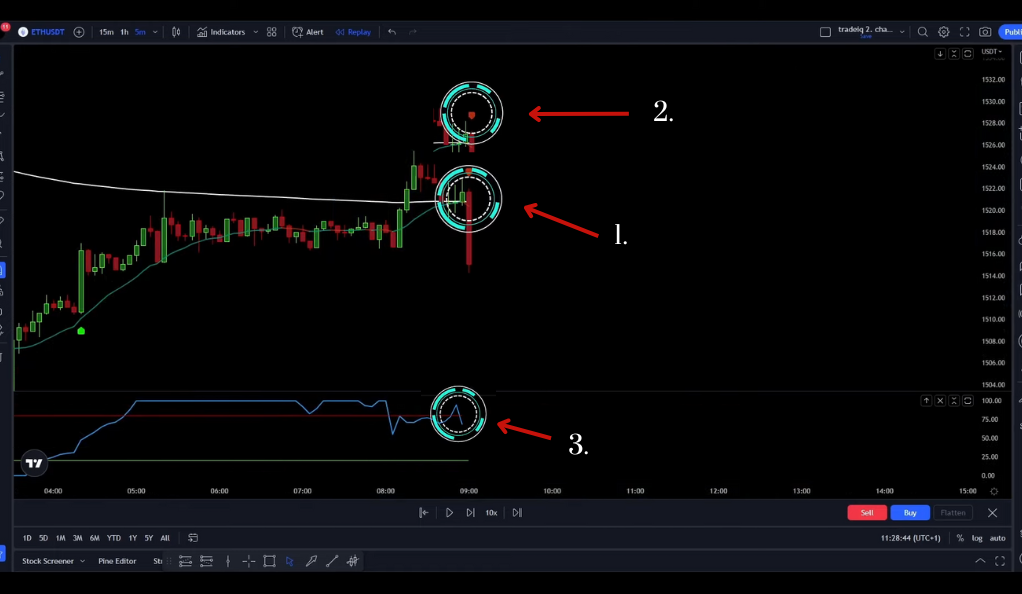
The exit strategy for short positions mirrors that of long positions. The stop loss is set at the recent swing high, and profit is booked once the line from the machine learning indicator turns green. This symmetry in the strategy ensures that whether you’re going long or short, you have a clear and effective plan of action.
Backtesting: The Proof is in the Pudding
Every good strategy needs to be tested, and this one is no exception. Backtesting was done using the Trader’s Edge app with an initial balance of $1,000 and a leverage of 2x. After 100 trades, the strategy yielded a win rate of 58% and a profit of 45.5%. These results are a testament to the strategy’s potential, demonstrating its ability to deliver consistent profits.
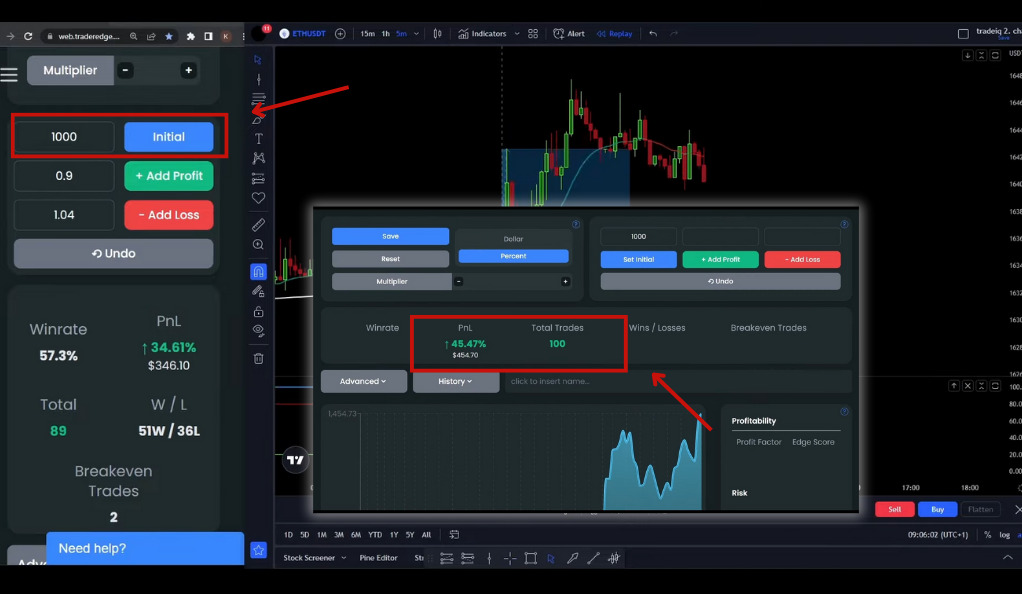
Backtesting is a critical step in validating any trading strategy. It allows traders to see how the strategy would have performed in the past, providing valuable insights into its potential future performance. The impressive results of this backtesting exercise provide a strong case for the effectiveness of this strategy.
Community Engagement: Sharing and Learning Together
The creator of this strategy encourages viewers to share their thoughts and ideas for using it differently. They also invite viewers to join their Telegram group via a Patreon membership. This sense of community fosters a collaborative learning environment where traders can learn from each other, share their experiences, and continuously improve their trading skills.
This emphasis on community engagement is a testament to the collaborative nature of trading. By sharing ideas and learning from each other, traders can continuously improve their strategies and trading skills. Whether you’re a seasoned trader or a beginner, being part of a trading community can provide invaluable support and insights.
Conclusion
In conclusion, this unique trading strategy that combines AI and a trio of trading view indicators offers a promising approach to trading. Its clear rules for entering and exiting positions, combined with its impressive backtesting results, make it a strategy worth considering. However, as with any trading strategy, it’s essential to do your own research, understand the risks involved, and use it in a way that aligns with your trading style and risk tolerance.
The world of trading is constantly evolving, and strategies like this one are a testament to the innovative ways traders are leveraging technology to gain an edge in the market. So, whether you’re a seasoned trader or just starting out, why not give this strategy a try? After all, in the world of trading, knowledge is power, and a good strategy could be the key to unlocking your trading potential. Happy trading!
Ainu Token aims to offer impartial and trustworthy information on cryptocurrency, finance, trading, and shares. However, we don't provide financial advice and recommend users to conduct their own studies and thorough checks.

Comments (No)