In the world of trading, strategies play a crucial role in guiding traders towards profitability. One strategy that has gained attention for its simplicity and effectiveness can be found on the YouTube channel “Power of Trading.” This strategy utilizes three free Tradingview indicators: Trend Magic, CM Sling Shot System, and CM MACD Custom Indicator.
The strategy operates by combining the signals generated by these three indicators to identify potential trading opportunities. The Trend Magic indicator helps determine the direction of the trend, while the CM Sling Shot System provides signals for potential reversals or continuation of the trend. Additionally, the CM MACD Custom Indicator offers insights into momentum and potential entry or exit points.
Traders following this strategy would typically monitor the charts and wait for the indicators to align in a way that suggests a high probability trade. For example, if the Trend Magic indicates an uptrend, the CM Sling Shot System generates a reversal signal, and the CM MACD Custom Indicator confirms bullish momentum, it could be seen as a potential buying opportunity. Similarly, traders would look for a combination of signals to identify potential selling opportunities.
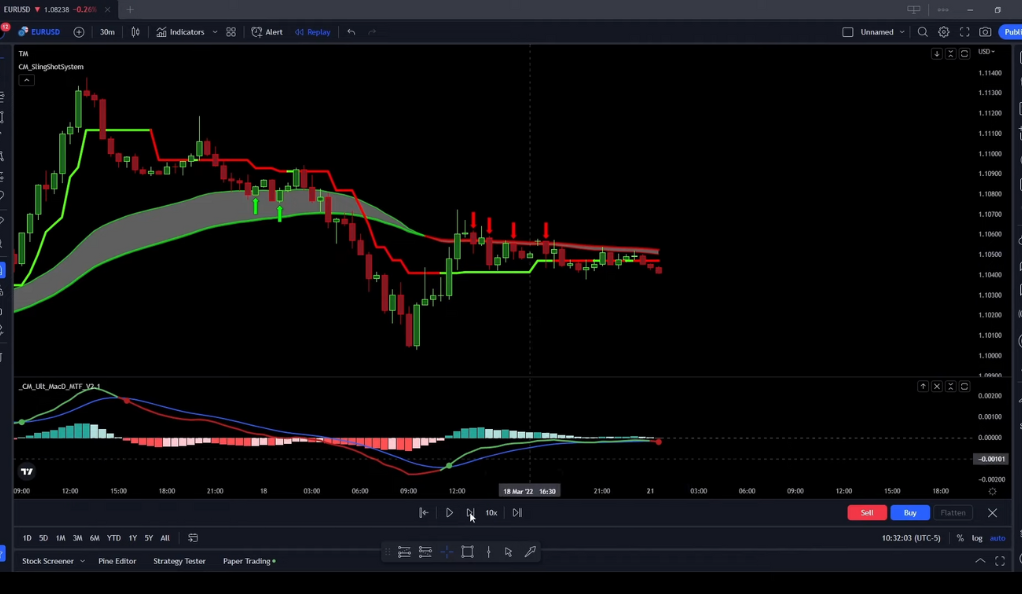
The Power of Three: Understanding the Indicators
The Power of Three strategy relies on three key indicators: Trend Magic, CM Sling Shot System, and CM MACD Custom Indicator. Each indicator serves a specific purpose in helping traders identify potential trading opportunities. Trend Magic determines the trend direction, CM Sling Shot System provides reversal signals, and CM MACD Custom Indicator offers insights into momentum. By combining the signals from these indicators, traders can make more informed decisions about when to enter or exit trades. Understanding how each indicator works and their interplay is crucial for successfully implementing the Power of Three strategy.
Trend Magic
Trend Magic is a straightforward yet effective indicator that helps traders identify buy and sell signals. The indicator uses either the Average True Range (ATR) period or the Commodity Channel Index (CCI) to generate these signals. When the line on the indicator turns green, it signifies a bullish or buy signal, suggesting that the market may be trending upward. On the other hand, a red line indicates a bearish or sell signal, indicating a potential downward trend. This simplicity makes Trend Magic user-friendly and accessible for traders looking to capitalize on clear trend signals in their trading decisions.
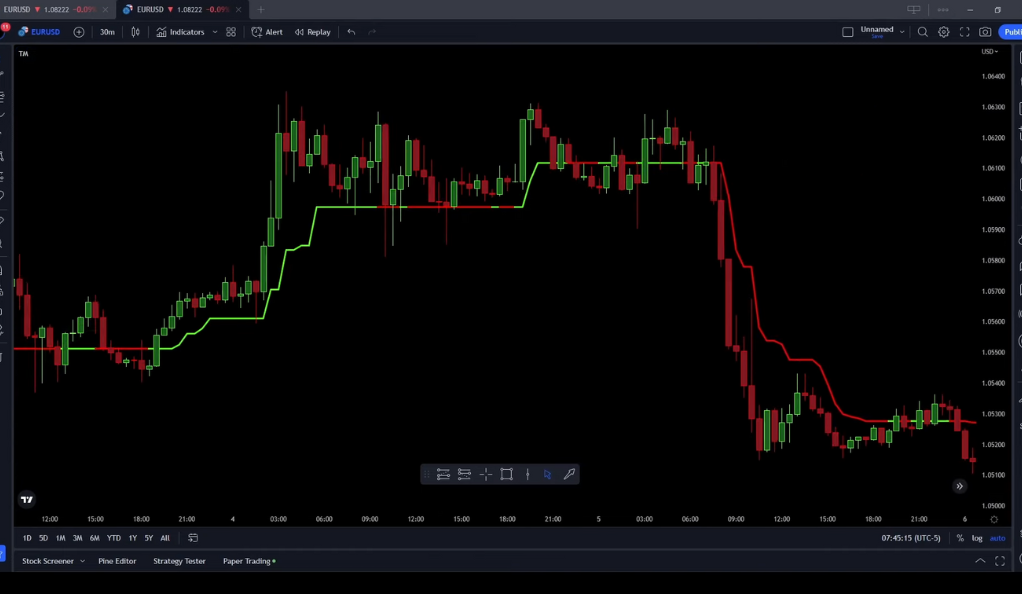
Traders utilizing the Trend Magic indicator can benefit from its visual clarity, as the color change in the line provides a straightforward signal for potential entry or exit points. However, it is important to note that no indicator is foolproof, and it is recommended to combine Trend Magic with other indicators or analysis methods to strengthen the overall trading strategy. Additionally, traders should consider factors such as market conditions, risk management, and their individual trading style before making any trading decisions based solely on the signals provided by the Trend Magic indicator.
CM Sling Shot System
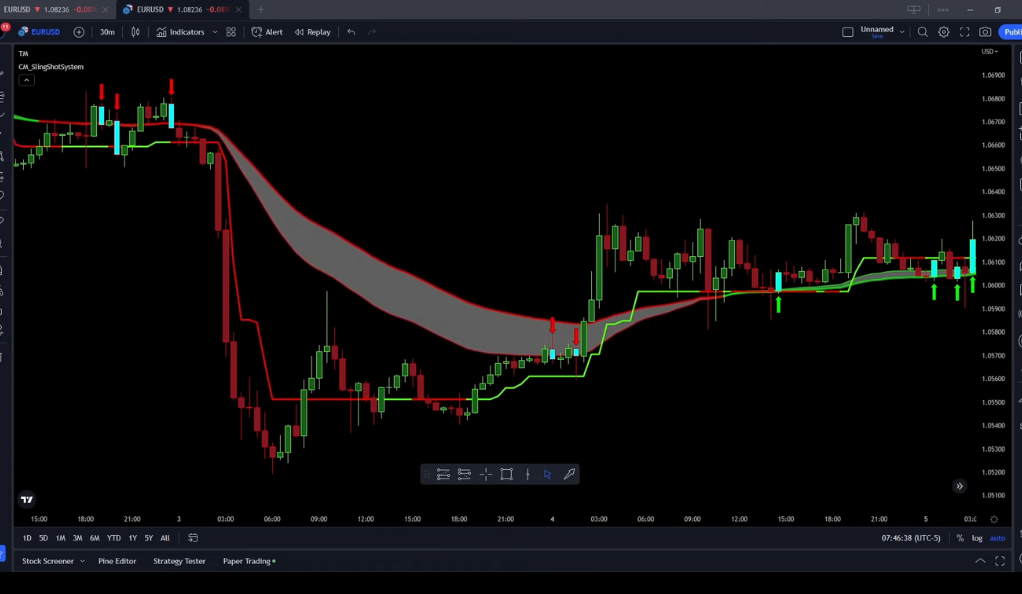
The CM Sling Shot System is a trend direction indicator that assists traders in identifying entry signals for trending moves. The indicator displays green and red clouds on the chart, which serve as visual cues for potential entry points. When the cloud turns green, it indicates a bullish trend, suggesting a favorable opportunity for buying. Conversely, a red cloud signifies a bearish trend, indicating a potential selling opportunity. This visual representation of trend direction helps traders make more informed decisions by providing clear entry signals.
One of the key advantages of the CM Sling Shot System is its ability to provide traders with defined entry points and stop levels. By using the indicator, traders can establish specific levels at which they can enter a trade with greater confidence and set stop-loss orders to manage risk. This feature makes the CM Sling Shot System a valuable tool for traders who seek a clear and systematic approach to their trading strategy. However, it is important to note that the indicator should be used in conjunction with other analysis techniques and risk management practices to maximize its effectiveness and mitigate potential risks.
CM MACD Custom Indicator
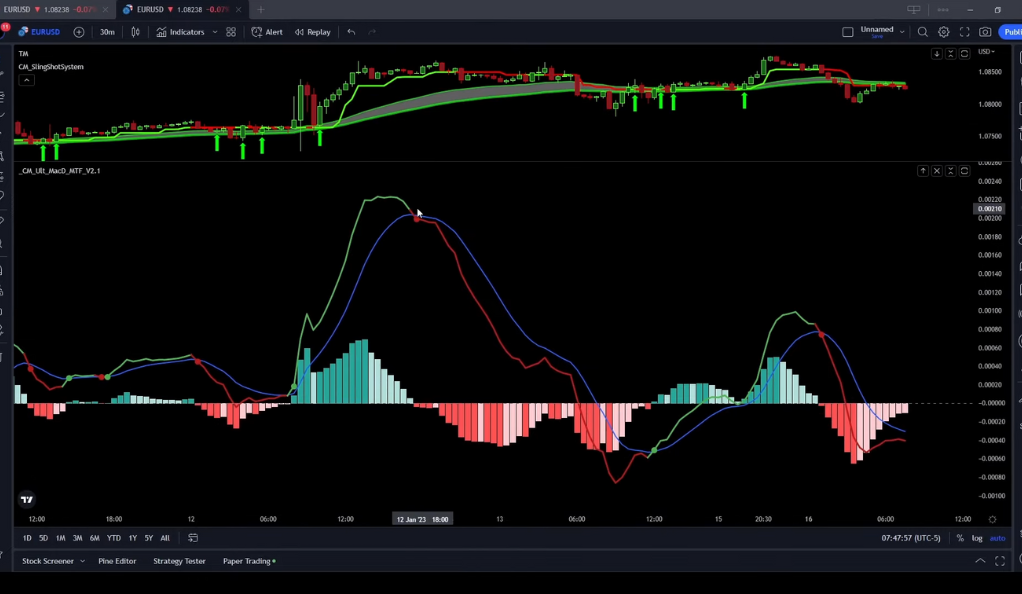
The CM MACD Custom Indicator is a popular tool primarily recognized for its green and red dots, which provide signals for entering positions. The indicator is based on the Moving Average Convergence Divergence (MACD) concept and is designed to simplify the interpretation of MACD signals. When the indicator displays a green dot, it suggests a potential buying opportunity, indicating that it might be a favorable time to enter a long position. Conversely, a red dot indicates a potential selling opportunity, suggesting that it might be an appropriate time to consider entering a short position. Traders often find the clear and visual nature of the dots helpful in making timely and informed trading decisions.
The CM MACD Custom Indicator typically utilizes default settings, which are preconfigured values established by the indicator developer. These default settings are commonly used as a starting point by traders, allowing them to get a general sense of the market conditions. However, it is important for traders to consider customizing the indicator settings according to their individual trading preferences and strategies, as different market conditions and trading styles may require specific adjustments. Additionally, as with any trading indicator, it is advisable to complement the signals provided by the CM MACD Custom Indicator with other technical analysis tools and risk management techniques to enhance the overall trading approach.
The Strategy: Entering Long and Short Positions
The strategy of entering long and short positions involves taking advantage of both upward and downward price movements in the market. Traders implementing this strategy aim to profit from both rising and falling prices by entering long positions when they expect the price to increase and entering short positions when they anticipate the price to decline. By carefully analyzing market trends, chart patterns, and using indicators or other analysis tools, traders can identify optimal entry points for both long and short positions. This strategy allows traders to diversify their trading approach and potentially capitalize on various market conditions, increasing the potential for profitability. However, it’s essential to employ risk management techniques and conduct thorough market analysis to minimize potential losses and maximize potential gains when implementing this strategy.
Going Long
When preparing to go long using the Power of Three strategy, several rules need to be followed. Firstly, a green dot should be printed by the MACD indicator, indicating a potential buying opportunity. Secondly, the CM Sling Shot System’s cloud should appear green, further confirming the bullish trend. Additionally, a green arrow should be visible, serving as an additional signal to enter a long trade. Finally, the Trend Magic Indicator line should be green, indicating a favorable uptrend. If all of these conditions align, traders can enter a long trade. To manage risk, it is recommended to place the stop loss below the green arrow, protecting against potential downward movement. Moreover, setting a target with a risk-to-reward ratio of 1 to 2 allows traders to potentially capture profit by aiming for a higher reward relative to the risk taken.
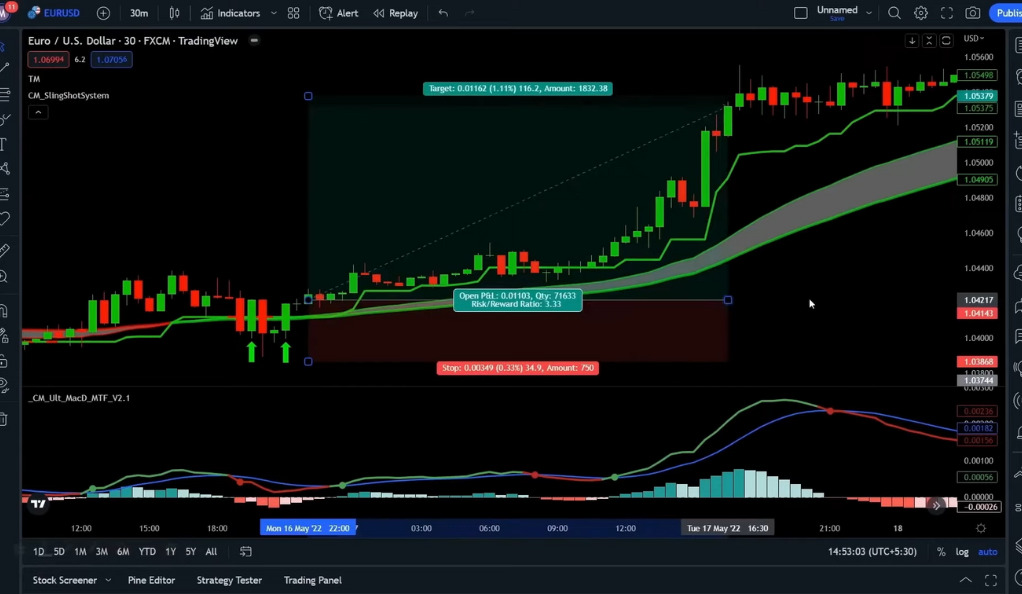
It’s important to note that while these rules provide a framework for going long, traders should exercise caution and consider additional factors such as market conditions, overall trend analysis, and individual risk tolerance. Furthermore, regularly monitoring the trade and making necessary adjustments, such as trailing the stop loss or taking partial profits, can be beneficial for optimizing returns and managing risk effectively.
Going Short
When looking to initiate a short position using the Power of Three strategy, traders should follow the inverse set of rules. Firstly, a red dot should be printed by the MACD indicator, indicating a potential selling opportunity. Secondly, a red arrow should be visible, serving as an additional confirmation signal to enter a short trade. Additionally, the CM Sling Shot System’s cloud should appear red, further validating the bearish trend. Lastly, the Trend Magic Indicator line should be red, signaling a favorable downtrend. If all of these conditions are satisfied, traders can consider entering a short trade. To manage risk, it is advisable to place the stop loss above the red arrow, guarding against potential upward movement. Furthermore, setting a target with a risk-to-reward ratio of 1 to 2 allows traders to aim for a higher reward relative to the risk taken.
While these rules provide guidance for going short, it is crucial to exercise caution and consider other important factors such as market conditions, overall trend analysis, and individual risk tolerance. Regularly monitoring the trade, adjusting the stop loss, and taking partial profits when appropriate can help optimize returns and manage risk effectively. Traders should also be mindful of potential market volatility and news events that could impact the success of their short positions.
Backtesting: The Trader Edge Application
Backtesting is an essential step in evaluating the effectiveness and reliability of a trading strategy. The Trader Edge application serves as a valuable tool for conducting backtesting. However, it is important to note that the trading rules presented in the original video can sometimes be confusing due to the examples provided. Traders should exercise caution and ensure they have a clear understanding of the specific rules and parameters before conducting backtesting using the Trader Edge application. It is advisable to carefully review and validate the trading strategy’s rules and methodology to ensure accurate and reliable backtesting results, ultimately helping traders make informed decisions about the viability and potential profitability of the strategy.
The Results: Win Rate and Loss
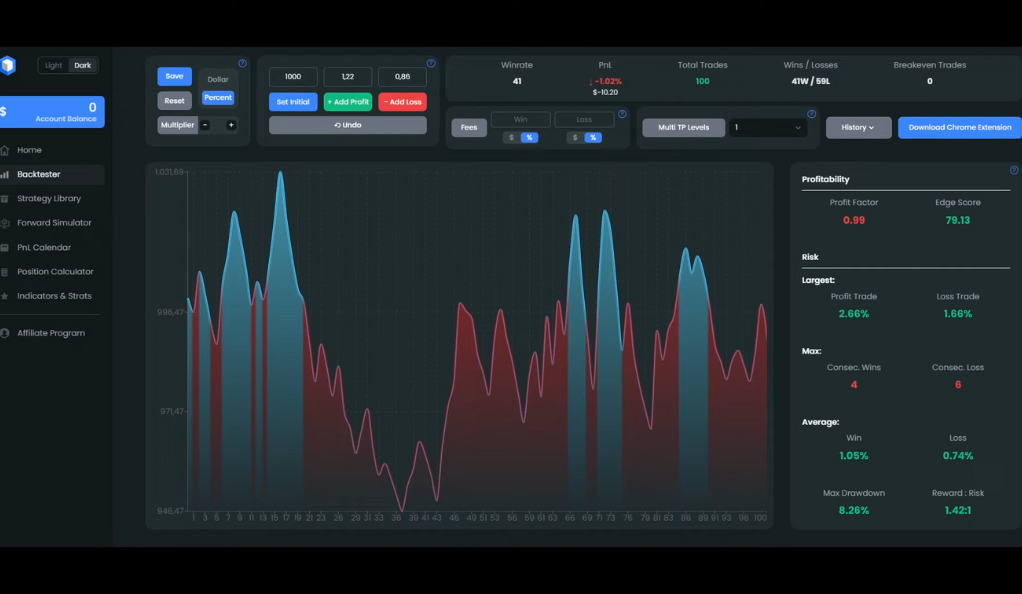
The backtesting results for the trading strategy revealed a win rate of 41% and a loss of 1%. While these numbers may not appear impressive at first glance, it’s important to remember that trading is a long-term game that requires patience and consistency. The win rate represents the percentage of successful trades out of the total trades taken, indicating that approximately 41% of the trades resulted in profits. On the other hand, the loss of 1% suggests that the average loss per trade was relatively small compared to the average profit per trade. This emphasizes the significance of risk management and maintaining a favorable risk-to-reward ratio to ensure that the strategy remains profitable over time. Traders should focus on the overall consistency of the strategy’s performance and consider factors such as risk management, trade management, and the ability to adapt to different market conditions when evaluating the effectiveness of the strategy.
Conclusion
In conclusion, the Power of Trading strategy, despite its simplicity, requires careful application and understanding. It’s ranked 36 out of 42, indicating there’s room for improvement. However, with diligent application and continuous learning, this strategy can be a valuable tool in a trader’s arsenal. Remember, the journey of trading is filled with learning, adapting, and growing. Happy trading!
Ainu Token aims to offer impartial and trustworthy information on cryptocurrency, finance, trading, and shares. However, we don't provide financial advice and recommend users to conduct their own studies and thorough checks.

Comments (No)